Getting reports using Google Analytics 4
Google Analytics 4 is a free and powerful tool that you can use to explore data on store traffic, customer behavior, purchases, and more. After you connect your store to Google Analytics, you can get detailed reports that will help you understand your sales and optimize customer experience.
Google Analytics has a wide variety of instruments. In this article, we’ll cover the basic features that you can use for your store right away. You can always dig deeper and explore additional possibilities if you like.
Before you start
When you connect Google Analytics to your store, the data does not appear immediately in your account. You need to wait up to 48 hours to see it in the reports. The only exception is the Realtime report – you can use it to see that your store is connected properly.
You will only see the events that actually took place in your store. So, if yours is a new store that does not have a lot of visitors yet, some data may not appear in the reports (e.g., you won’t see any purchase information until you have sales). You will also see only the events that took place after you’ve connected the store to Google Analytics.
If you’re only starting and don’t have enough data for your store, you can always connect a Google Analytics demo account to see a sample of what Google Analytics 4 may offer and to get familiar with the interface. This account contains real data for Google Merchandise Store. As that’s an ecommerce store, it’s a really helpful example for you as a merchant. You can navigate the Google Merchandise Store data and use it to create sample custom reports.
Learn more about Google Analytics 4 in Google’s Help Center →
Viewing reports
You can find all the preconfigured reports for your store in the Reports section of your Google Analytics 4 account.
The overview of these reports is given in the Reports snapshot – that’s the first page you see when entering your account. There you can find the essence of what’s happening in your store, including the number of users and total revenue.
In the right upper corner, choose the time period for which you want to see the report.
Currently, the series of reports available in the Reports section includes:
- Realtime overview – data on your store visitors over the last 30 minutes, including their number, geographical locations (you can see them on the map), devices they used to view your store, where they came from, viewed pages, etc.
- Acquisition – data on how store visitors find your website, where they come from. In this section, you can find the biggest traffic sources that are sending buyers to your store (organic, referral, email, etc.).
- Engagement – data on how your store visitors interact with your website (time spent, viewed pages, events, conversions, etc.).
- Monetization – ecommerce data on your sales (including revenue, total purchases, purchased items, and more).
- Retention – data on user retention over time.
- Demographics – data about your audience, including their countries, cities, and preferred languages.
- Tech – detailed data on the devices, browsers, operational systems, etc. that visitors used while browsing your store website.
You can watch this video by Google to get a detailed picture of the Google Analytics 4 user interface:
Marking events as conversions
In Google Analytics 4, you can use conversion events to measure store visitor activities that interest you most. These can be such important events as buying a product or visiting your store for the first time. Once you mark your special events as conversions, you can get reports on them (e.g., the number of conversions over time).
By default, when you connect your store to Google Analytics, you have only the purchase event marked as a predefined conversion. You can add other events if you need.
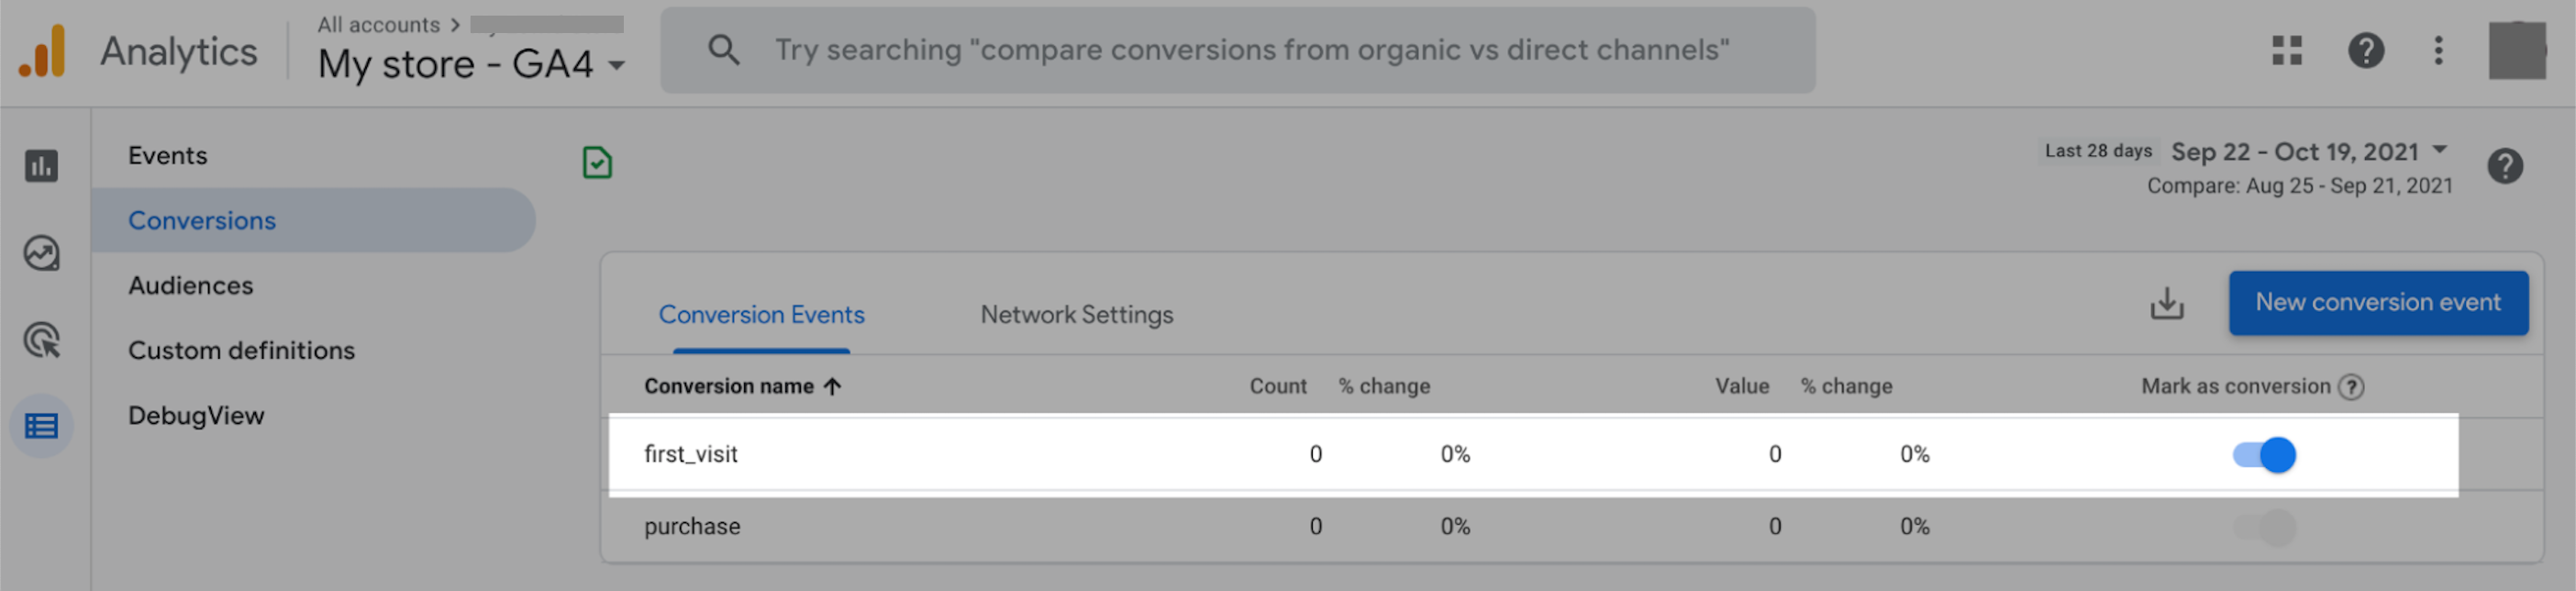
To mark events as conversions:
- Go to Google Analytics → Configure → Events.
- In the table, find the event you need.
- Switch the toggle to mark the event as a conversion:

That’s it! The event is marked as a conversion. Now you can see this event (along with other conversions) in the Configure → Conversions page:
You can also create custom conversion events. For example, to track visits to specific pages of your store.
In about 24 hours, the new conversion event will appear in your reports. For example, you can see conversions in Reports → Engagement → Conversions or in Reports → Acquisition → Traffic acquisition (the Conversions column). You can also use them in your custom reports.
Collecting customers’ search terms
You can automatically collect the terms that your customers typed into the search field in your store. To be able to store historical data on the search terms, you will need to add a custom dimension to the search_term parameter of the view_search_results event.
To create a custom dimension:
- Go to Google Analytics → Configure → Custom definitions.
- Click Create custom dimensions:

- In the Dimension name field, enter the name of the dimension, e.g., “Customer search term”.
- In the Scope dropdown, choose Event.
- (optional) In the Description field, add a description, e.g., “Search terms used by customers”.
- From the Event parameter dropdown, choose search_term:

- Click Save.
After you create a custom dimension, the data on the search terms used in your store will start being collected. You will be able to see it in your account in about 24 hours.
To see a list of the search terms used in your store:
- Go to Google Analytics → Reports → Engagement → Events.
- In the list, find the view_search_results event and click on it.
- On the opened page, scroll down until you see the list of search terms (it will be named after the custom dimension that you’ve created):

In the right upper corner, you can choose the period of time for which you want to see the search terms.
You can also view the most recent search terms on top of the page, in the Events in last 30 minutes section. For that, select search_term from the Parameter name dropdown:

If you’re looking for additional ways to analyze the search behavior of your customers, check out the CloudSearch app.
Creating explorations: Funnel
In the Explore section of your Google Analytics 4 account, you can create custom reports using a series of templates. Click Template gallery to see the full list of available templates.
Explorations can help you get in-depth insights into customer behavior and more. You can adjust the templates to your needs and take into consideration only those parameters that make sense for your business.
One of the most important explorations for an ecommerce store owner is the Funnel exploration. It can help you analyze how your customers move through different steps of the store visit, starting from the moment they enter your store until the moment they actually make the purchase (if they do). To build the steps of the funnel, you can use various conditions, including the events that you’re already tracking.
Here is how you can create a basic funnel analysis report for your store:
- Go to Google Analytics → Explore.
- Click the Funnel exploration tab to open a predefined report that you can edit:

Clicking the Blank tab allows you to design a new exploration from scratch.
- In the Tab Settings column, delete all the steps by clicking a cross next to them:

- When you’re done deleting the predefined steps, click on the pencil icon in the Steps block to add new steps to the funnel:
- Enter the name of the first step of your funnel (e.g., “Product viewed”)
- From the Add new condition dropdown, choose the view_item event:

- Click Add step, and similarly add steps for the add_to_cart and purchase events.
- In the right upper corner, click Apply:

That’s it! You have created a simple conversion funnel that includes three steps: viewing a product, adding it to cart and buying the product:
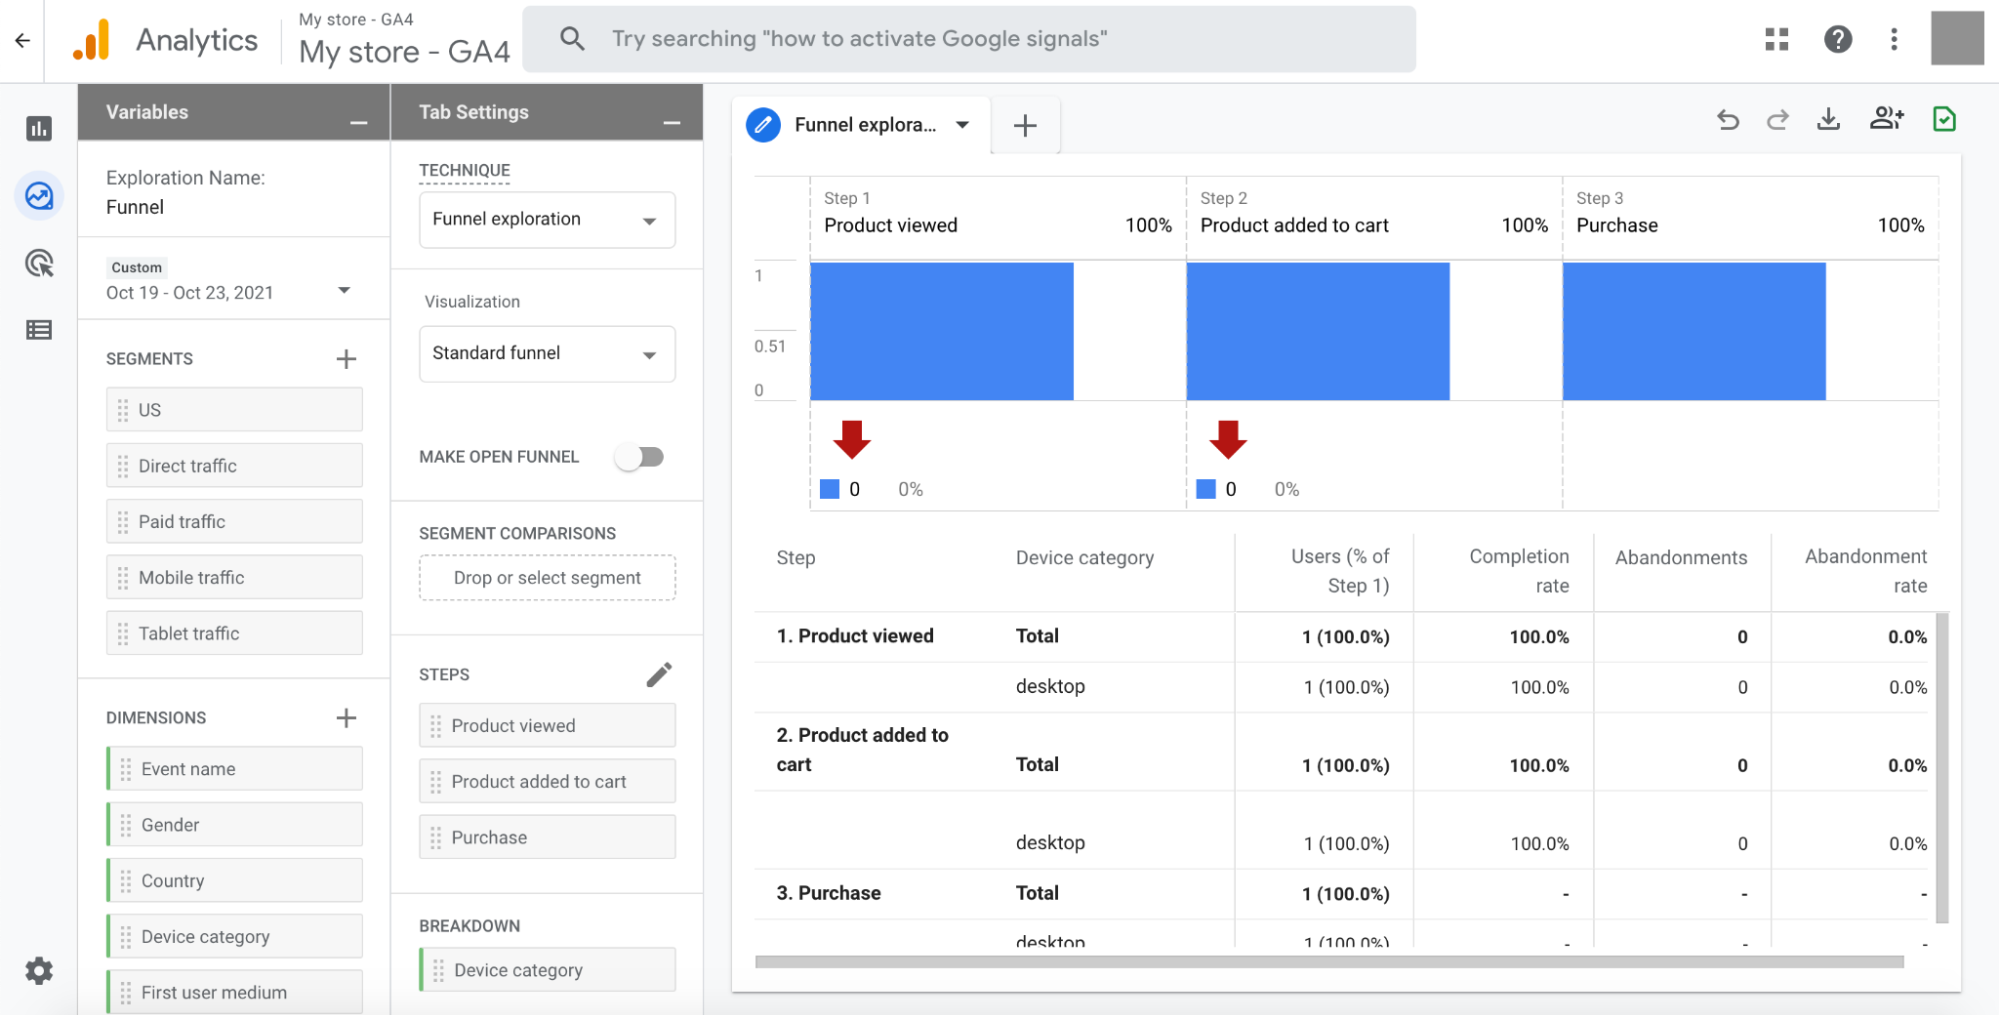
Now you can explore the graph further to analyze your customer behavior.
You can also add different metrics to the exploration to dig deeper:
- In the Tab Settings column, add Event Name to the Next Action block to see where your customers go if not to the next step in the funnel. You will see their destination actions when you hover your cursor over the corresponding step on the funnel graph.
To use Event Name for the breakdown, you should have Event Name in the Dimensions block of the Variables column.
- Enable the Show Elapsed Time toggle to see how long it takes customers to reach the next step of the funnel.
- Enable the Make Open Funnel toggle to analyze customers who enter at any step (unless you do it, only visitors who enter on the first step appear in the funnel).
- Add filters, dimensions, etc.